1. Why Does the S&P 500 Matter?
The S&P Top 50 Folio offers a way for investors to access the largest, most liquid and most influential US-listed companies tracked by the S&P 500 index.
The benchmark is often used as a barometer for the health of the US economy. Fears about a recession sent it into correction territory in early March.
Here, we take a look at the top 15 constituents in the S&P 500 by market cap and highlight why, notwithstanding recent upsets, the important roles they play in their respective industries may make them interesting investment opportunities.
All the data is based on results and market metrics available within the OPTO app. This content shouldn’t be taken as investment advice and is for informational purposes only.
2. The Strength of the S&P 500’s Top 50
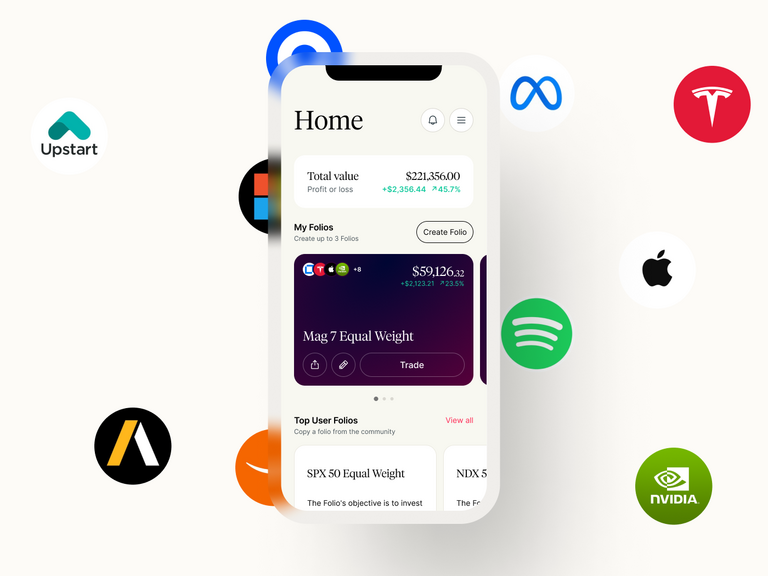
Offering in-built diversification, an OPTO Folio is an investable basket of between three and 50 stocks that can be centered on a particular theme or strategy. Folios are rebalanced quarterly, ensuring long-term alignment with the user’s chosen weighting strategy.
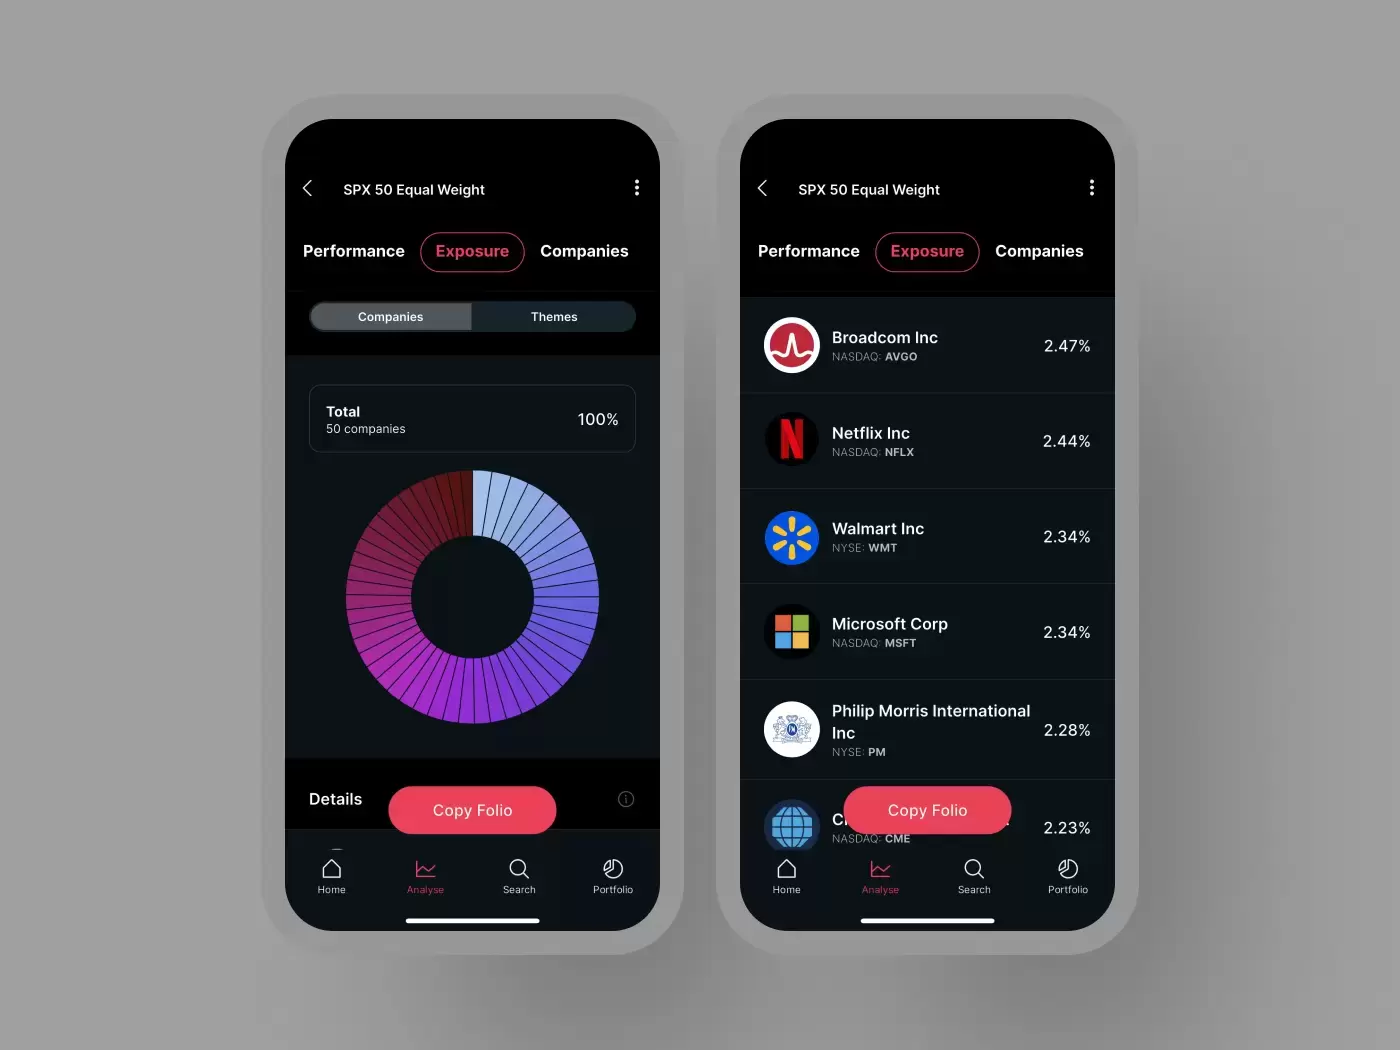
The S&P Top 50 Folio is weighted according to market cap, so the bigger stocks represent bigger portions of the total.
There are significant potential advantages to this approach. It gives investors higher exposure to larger and less volatile stocks, and mirrors the broader market: when stocks grow in value, so does their Folio weighting.
A potential limitation to this approach is that returns from smaller stocks have less influence on Folio performance. There is also a risk of over-concentration in a few large companies.
Investing in the S&P Top 50 Folio will give you a stake in companies that span the tech, pharmaceutical, financial services, and oil and gas industries.
As a snapshot of what this bundle of stocks has to offer, we have highlighted the top fifteen by market cap. They’ve reached their current position because they’ve been able to corner the markets they operate in and have a history of generating strong and consistent earnings and revenue growth.
A number of these companies are also sitting on huge cash piles, which allows them to increase capital expenditure and returns to shareholders.
While worries about the US economy could weigh on the share prices of these 15 stocks in the near-term, their financial strength, market dominance and ability to innovate and adapt means that they could deliver better returns than the broader market over the long-term.
3. Back-Tested Performance

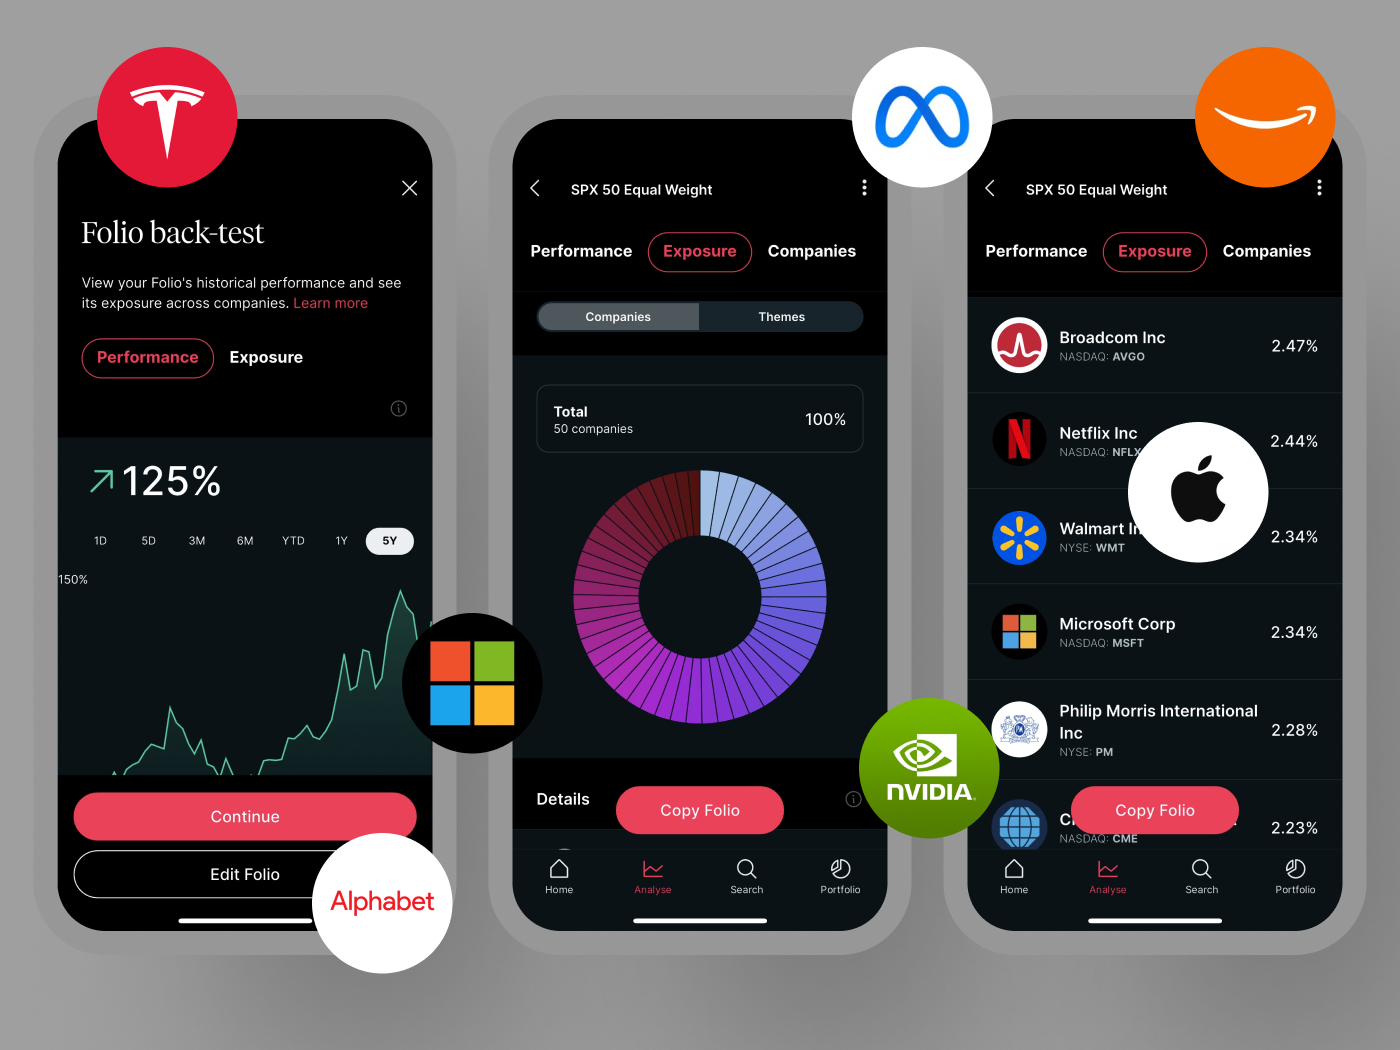
The S&P Top 50 Folio is down 0.64% since January 1 through May 6 versus a 4.67% drop for the S&P 500.
Using the back-testing function of the OPTO app, we can see the S&P Top 50 Folio’s performance versus the S&P 500 over the medium and long term.
The stocks in the S&P Top 50 Folio returned 15.5% in the past 12 months, compared to the index’s 9.34% rise. Over the past five years, they returned 125% versus the index’s 95.47% rise.
Large-cap companies can capitalize on tech trends quickly to corner the market and gain a competitive advantage. This analysis shows how exposure to them could potentially lead to higher returns in the long run.
4. Who Are the Top 15?
Here’s an overview of recent developments from the top 15 of the stocks to which the S&P Top 50 Folio offers exposure.
Apple [AAPL]
Market cap: $3.2trn
Weighting: 15.1%
EPS growth this year: 23.19%
Revenue growth this year: 6.82%
The iPhone maker is renowned for its cutting-edge hardware and software. It’s reportedly set to overhaul its operating systems later this year in the hope of giving flagging sales a boost.
Nvidia [NVDA]
Market cap: $2.97trn
Weighting: 14%
EPS growth this year: 53.12%
Revenue growth this year: 58.67%
The so-called ‘king of chips’ has seen its valuation rise rapidly over the past couple of years, turbocharged by hopes about the transformative potential of generative artificial intelligence (AI). The company currently holds a 70–95% share of the AI chip market, according to Mizuho Securities.
Microsoft [MSFT]
Market cap: $2.88trn
Weighting: 13.6%
EPS growth this year: 13.26%
Revenue growth this year: 15.22%
The software maker is a leader in AI-capable PCs — the Windows operating system was installed on 45% of all such devices in 2024, Canalys data shows. The Redmond, Washington-based company also had a 21% share of the cloud infrastructure services market in Q4 2024.
Amazon [AMZN]
Market cap: $2.09trn
Weighting: 9.8%
EPS growth this year: 16.60%
Revenue growth this year: 11.69%
The e-commerce giant is the leader in the cloud infrastructure services market, with a 30% share as of December 31. The company plans to spend $100bn on AI in 2025, with CEO Andy Jassy calling it a “once-in-a-lifetime business opportunity”.
Alphabet [GOOGL]
Market cap: $2.02trn
Weighting: 9.5%
EPS growth this year: 14.53%
Revenue growth this year: 14.65%
Google’s parent company is projecting capex of $75bn this year as it continues its AI push. It’s also planning to expand its Waymo robotaxi service. Meanwhile, Google Cloud had a 12% share of the cloud infrastructure services market in the last quarter.
Meta [META]
Market cap: $1.54trn
Weighting: 7.2%
EPS growth this year: 8.29%
Revenue growth this year: 16.88%
The Facebook owner is targeting annual capex of $60bn–$65bn, largely on AI infrastructure and up from $28bn in 2023. It is also reportedly testing its own in-house chip for AI training, to reduce its reliance on suppliers including Nvidia.
Berkshire Hathaway [BRK-B]
Market cap: $1.11trn
Weighting: 5.2%
EPS growth this year: -50.26%
Revenue growth this year: 3.77%
Between 1965 and 2024, Warren Buffett’s investment firm delivered a compound annual gain of 19.9%, almost double the S&P 500’s 10.4% gain. Berkshire’s cash pile stood at a record $334.2bn at the end of last year, which means it’s well placed to go bargain hunting during any economic downturn.
Broadcom [AVGO]
Market cap: $919bn
Weighting: 4.3%
EPS growth this year: 418%
Revenue growth this year: 21.51%
The semiconductor giant is a major player in the AI chip market. Its custom chip unit, which makes AI processors for cloud providers, offers customers a cheaper alternative to Nvidia’s Blackwell GPUs. AI revenue for Broadcom’s fiscal Q1 2025, which ended February 2, was up 77% year-over-year.
Tesla [TSLA]
Market cap: $804bn
Weighting: 3.8%
EPS growth this year: 38.47%
Revenue growth this year: 16.56%
The EV maker has seen its valuation reverse in recent weeks as sales slow — shipments slumped 49% in China in February — and investors grow concerned about Elon Musk’s role in US politics. The company is reportedly planning to launch a cheaper Model Y to spur demand in China.
Eli Lilly [LLY]
Market cap: $730bn
Weighting: 3.4%
EPS growth this year: 99.16%
Revenue growth this year: 32.92%
Eli Lilly is the biggest pharma company in the world by market value, mainly thanks to its blockbuster obesity and diabetes drugs Zepbound and Mounjaro. Their sales brought in $3.53bn and $1.91bn respectively in Q4 2024, accounting for 40% of total revenue.
Walmart [WMT]
Market cap: $684bn
Weighting: 3.2%
EPS growth this year: 15.54%
Revenue growth this year: 4.59%
The retailer has undergone a dramatic transformation in recent years, from a brick-and-mortar-focused grocer to an e-commerce giant. Global online sales grew 16% in its Q4 2025, which ended January 31, making up 18% of total sales.
JPMorgan [JPM]
Market cap: $650bn
Weighting: 3%
EPS growth this year: -6.19%
Revenue growth this year: 6.72%
The investment bank may not be the most exciting of stocks, but the company has a strong track record of beating revenue and profit estimates. Assets under management at the end of Q4 2024 were $4trn, up 18% year-over-year.
Visa [V]
Market cap: $648bn
Weighting: 3%
EPS growth this year: 18.44%
Revenue growth this year: 12.46%
The fintech firm’s technology plays a key role in global commerce infrastructure. It processed 234 billion transactions in its fiscal 2024 ending September 30 — approximately 640 million a day — and had a total payments and cash volume of $16trn.
ExxonMobil [XOM]
Market cap: $485bn
Weighting: 2.3%
EPS growth this year: -4.95%
Revenue growth this year: -0.66%
The largest US oil producer’s total adjusted earnings for 2024 were $33.46bn and the company announced last December that it wants to boost annual earnings by $20bn by 2030. Approximately $36bn in dividends and buybacks was handed back to shareholders last year.
Mastercard [MA]
Market cap: $482bn
Weighting: 2.3%
EPS growth this year: 17.70%
Revenue growth this year: 15.39%
The second-largest payments processor in the world behind Visa, Mastercard is expecting to report slower annual revenue between 2025 and 2027. However, cross-border payments volume has become a key driver for the business and was up 20% in the most recent quarter.
5. The Trends Driving the S&P
5G has the largest allocation in the S&P Top 50 Folio, with 8.33%. As the global rollout of the latest generation of wireless technology continues, the theme offers exposure to the companies responsible for designing and building the critical components of 5G infrastructure. Broadcom has a multi-billion dollar 5G chip deal with Apple, which launched its own 5G modem for iPhones in February.
The second biggest allocation goes to data center and digital infrastructure, with 7%. This is not surprising given the accelerated deployment of generative AI and the need for power to meet this demand.
Generative AI is also driving investments in cloud computing and could account for 10–15% of the $2trn cloud spending by 2030, according to Goldman Sachs. The cloud computing theme has the third-biggest allocation, at 6%. It offers exposure to all the big tech hitters, including Alphabet, Amazon and Microsoft. Cloud infrastructure service providers generated $91bn in Q4 2024, up 22% year-over-year.
Fintech and semiconductors are in fourth and fifth place with allocations of 4.97% and 4.89%, respectively. Both themes are tied to the broader AI industry.
Meanwhile, immunology has a 4.10% allocation; interest in biotechs has increased significantly since Covid-19 and the discovery of new therapeutics is being aided by AI.

6. More Reading on the S&P’s Top 15
Before you consider investing in the S&P Top 50 Folio, here are some recent OPTO articles that highlight the important roles some of the top stocks of the S&P 500 are playing in their respective industries.
- What Does Buffett's Cash Pile Mean for BRK Stock?
- 4 Fintech Stocks to Watch: Incumbents vs. Upstarts
- Is This Biopharma Stock the “Nvidia of Weight Loss”?
- AMD Stock vs. NVDA Stock: Who’s Winning the Chip Race?
7. Conclusion
To explore and potentially invest in the top constituents of the S&P 500, you can copy Folio on the OPTO platform. For more on how to do this, click here.
If you’ve decided to invest in the S&P Top 50 Folio, then it’s important to note that, while its leading constituents may face headwinds in the near-term, their strong balance sheets, earnings and revenue growth mean they should be able to weather periods of economic volatility.
Remember, this article is for informational purposes only and doesn’t constitute financial advice. You should conduct your own research before making any investment decisions.
The content of this article is for general informational purposes only. All examples are for illustrative purposes only.
Past hypothetical backtest results do not guarantee future returns, and actual results may vary from the analysis.
All investments involve risk, and the past performance of a security, or financial product does not guarantee future results or returns. There is no guarantee that any investment strategy will achieve its objectives. Please note that diversification does not ensure a profit, or protect against loss. There is always the potential of losing money when you invest in securities, or other financial products. Investors should consider their investment objectives and risks carefully before investing.
OPTO Markets LLC is not a broker-dealer, investment adviser or member of FINRA. Please see www.optothemes.com. Securities offered by Alpaca Securities LLC (“Alpaca Securities”).
Alpaca Securities, LLC (“Alpaca Securities”) is not responsible for and is not providing the technology and services you receive from us to access and manage your brokerage account with Alpaca Securities. You firmly agree to hold Alpaca and its affiliates, owners, directors, employees, clearing firm and agents harmless for any loss or damage arising from the use of or unavailability of the technology and services that we are providing.
Alpaca Securities is a member of FINRA and the Securities Investor Protection Corporation. Pursuant to FINRA Rule 4311, Alpaca Securities and Opto and have entered into an agreement where Alpaca provides clearing services for the Opto platform. For further information, please refer to the Alpaca Disclosure Library.
Disclaimer Past performance is not a reliable indicator of future results.
CMC Markets is an execution-only service provider. The material (whether or not it states any opinions) is for general information purposes only, and does not take into account your personal circumstances or objectives. Nothing in this material is (or should be considered to be) financial, investment or other advice on which reliance should be placed. No opinion given in the material constitutes a recommendation by CMC Markets or the author that any particular investment, security, transaction or investment strategy is suitable for any specific person.
The material has not been prepared in accordance with legal requirements designed to promote the independence of investment research. Although we are not specifically prevented from dealing before providing this material, we do not seek to take advantage of the material prior to its dissemination.
CMC Markets does not endorse or offer opinion on the trading strategies used by the author. Their trading strategies do not guarantee any return and CMC Markets shall not be held responsible for any loss that you may incur, either directly or indirectly, arising from any investment based on any information contained herein.
*Tax treatment depends on individual circumstances and can change or may differ in a jurisdiction other than the UK.
Continue reading for FREE
- Includes free newsletter updates, unsubscribe anytime. Privacy policy


